Data Visualization
U.S. Program for the International Assessment of Adult Competencies (PIAAC) Skills Map
The PIAAC Skills Map is a highly intuitive interactive map that allows users to explore and compare statistics regarding adult literacy and numeracy skills in the 50 states, all 3,141 U.S. counties, and the District of Columbia.
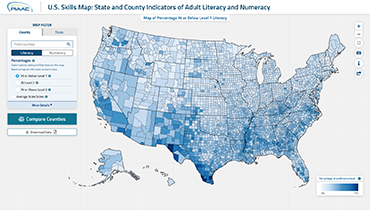
The Skills Map uses PIAAC survey data and American Community Survey data. This standalone web application was developed for simplicity to use based on data furnished in CSV files with the results rendered in a web browser. Westat applied leading-edge web and visualization tools and technologies, including R, Invision, React, Material UI, and D3 JavaScript library, in the development of this site.
Federal Employee Viewpoint Survey (FEVS)
The FEVS results dashboard, created for the Office of Personnel Management, provides agency leaders and managers insight into study response rates and progress during a 7-week period.
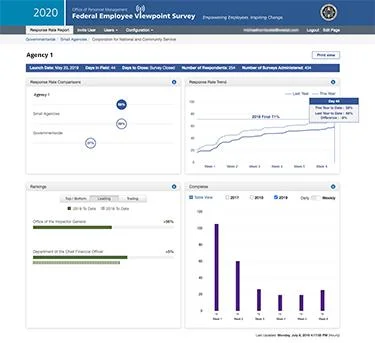
Visualization and dashboard techniques provide users the ability to monitor study progress at various levels: government level, agency level, and subagency level. Users can manage study progress through comparisons, rankings, trends, and completes.