The increasing need for the collection and analysis of massive amounts of data has made the use of data visualization more important than ever. The visual representation of information helps clients and internal managers easily see and understand patterns, trends, and outliers, enabling them to quickly make informed decisions. In this Q & A, Kevin Wilson, Ph.D., a Principal Research Associate, explains how data visualization is helping clients meet their mission and what the future holds for sharing data visually and making sense of it.
Q. How can employing data visualization help clients?
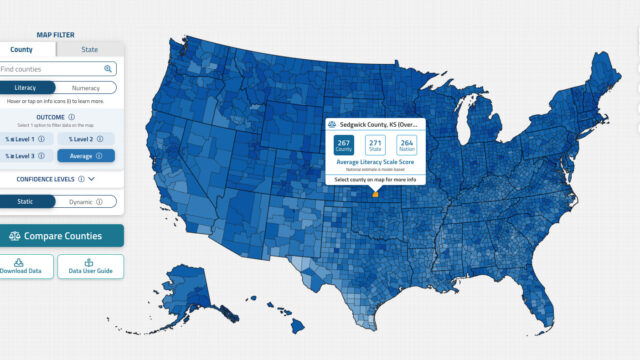
A. By using visual elements, such as graphs, charts, and maps based on the principles of visual perception, we can present data in ways that clients can easily absorb, providing them with actionable insights to support their decisions. Because data visualization techniques are effective at summarizing complex data, they can provide a high-level view, which can lead to new insights.
Q. How does Westat use data visualization effectively?
A. We use data visualization across many areas of our work, including on large-scale surveys, public health and epidemiological research studies, clinical trials, and education studies. We have developed interactive dashboards and visualizations to track and map the incidence of cancer in the U.S., measure enrollment and data quality in clinical trials, summarize student academic progress, and track interview metadata and quickly identify administrative issues for correction in large-scale surveys, to name a few.
Q. What value does Westat’s data visualization expertise bring to clients?
A. Our interdisciplinary team comprises visual perception experts, data scientists, statisticians, and application developers. We collaborate to build end-to-end systems that work together seamlessly to meet our clients’ needs. We understand how people process information visually and use that knowledge to create intuitive visual elements that help clients see the forest without the trees. We also use social media tactically to disseminate data in clear, concise, and eye-catching ways.
Q. What data visualization tools and techniques does Westat use?
A. Depending on the needs of the study or survey, we choose from a range of data visualization tools, including commercial tools like Tableau and open-source tools like R Shiny. Where visualizations need significant customization or interactivity, we can develop custom solutions using the latest web technologies.
Q: How does Westat use data visualization to improve internal survey operations?
A. We developed a data visualization platform we call the Platform for Dynamic Decisions Dashboard or Pd3 (YouTube video). We use it to power some of our survey performance and multimode dashboards as well as in field operations to monitor interviewer performance and completed interviews. By integrating information from various sources into a customizable dashboard platform with simple designs and color coding, Pd3 can present complex data that are easily digestible by both survey managers and clients.
Q. What trends are on the horizon for data visualization?
A. Society is shifting. Our attention spans are shorter and our tolerance for details lower. The future may demand only a single posting on social media to communicate an idea or message. Westat is currently exploring new data visualization tools and techniques to communicate data-rich stories concisely, simply, and meaningfully to meet our clients’ research needs.

-
Expert Interview
Addressing America’s Shortage of Safe, Stable Foster HomesJune 2026
To help ensure children entering foster care are placed in safe, stable, and supportive family environments, the federal government recently unveiled an agencywide initiative to…
-
Perspective
Westat’s AI Governance Framework Balances Innovation, Quality, and TrustJune 2026
As the use of artificial intelligence (AI)-driven methods in research continues to expand, organizations face increasing pressure to maintain high standards for quality while safeguarding…
-
Perspective
Westat Shares Survey Expertise at AAPOR 2026May 2026
Westat experts will be presenting at the 81st Annual American Association for Public Opinion Research (AAPOR) Conference, taking place in Los Angeles, California, May 13–15. They…