This website uses cookies so that we can provide you with the best user experience possible. Cookie information is stored in your browser and performs functions such as recognizing you when you return to our website and helping our team to understand which sections of the website you find most interesting and useful.
Introduction
Small area estimation (SAE) includes a variety of statistical techniques to predict survey outcomes typically for small geographic areas. Sampling information and data from the survey are used in conjunction with correlated data from other data sources in statistical models to produce the estimates of interest. Demand for reliable estimates through SAE has increased in the past decades, and over the same time, there have been significant enhancements made in SAE methodology and approaches. In 2019-2020, Westat used advanced statistical methodology to produce state and county indirect estimates of average scores and various proficiency levels of adults for individual U.S. states and counties, using data from the first cycle of the Program for the International Assessment of Adult Competencies (PIAAC).
“Demand for reliable estimates through SAE has increased in the past decades.”
Key Highlights
- Significant enhancements have been made in SAE methodology and approaches.
- SAE enhancements help policymakers make more readily available data comparisons.
- Westat designed a sophisticated statistical SAE modeling approach to produce model- based estimates for the Program for the International Assessment of Adult Competencies (PIAAC).
PIAAC is sponsored by the National Center for Education Statistics (NCES) and is part of a series of adult skills surveys, which have been implemented in the U.S. The first cycle of PIAAC included three national data collections (in 2012, 2014, and 2017), which surveyed 12,330 individuals, 16-74 years old. An international study involving over 35 countries, PIAAC is a survey that examines a range of basic workforce skills and assesses proficiency in literacy, numeracy, and digital problem solving
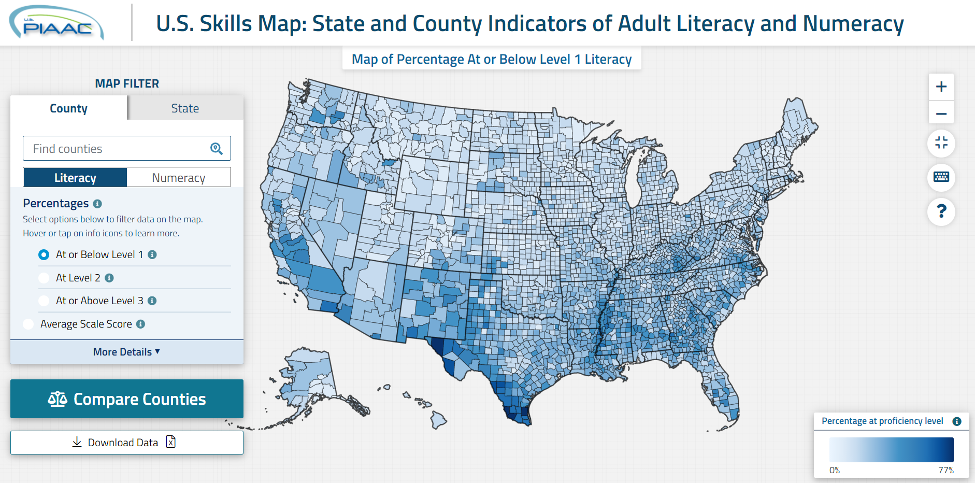
consistently across participating countries. PIAAC is designed to produce standard survey estimates—direct estimates—of proficiency (reported either as average scale scores or in terms of proficiency levels) in these three domains with adequate levels of precision for the target population as a whole as well as for major population subgroups (e.g., subgroups defined by region, level of educational attainment, or race/ethnicity) within the target population. U.S. participation in PIAAC in the 2010s was limited to nationally representative samples, not designed to yield reliable data about proficiency levels of adults’ skills at the level of states and counties. To meet the need for state- and county-level estimates of adult skills, Westat, under a contract with NCES, reviewed a range of possible methods for SAE, which could generate state and county estimates. Based on this review and input from international experts, a sophisticated statistical modeling approach was selected and used to produce indirect estimates, which are available to the public on the PIAAC Skills Map website, which can be accessed by visiting https://nces.ed.gov/surveys/piaac/ skillsmap/, with background and supplemental information provided here https://nces.ed.gov/surveys/ piaac/state-county-estimates.asp. Figure 1 shows the landing page for the PIAAC Skills Map. The indirect estimates are predictions of how the adults in a state or county would have performed had they been administered the PIAAC assessment.
The statistical modeling approach that was selected for this purpose produces or “models” four different state- and county-level estimates for adult literacy and numeracy proficiencies:
- an average score (on the PIAAC scale of 0–500),
- the proportion of adults
- at or below Level 1,
- above Level 1 and below Level 3 (referred to as “proportion at Level 2”), and
- at Level 3 and above (based on PIAAC’s five proficiency levels for literacy and numeracy).
These model-dependent estimates are called “indirect” (or small area) estimates to distinguish them from “direct” (or standard) estimates that do not depend on the validity of a statistical model. The state and county indirect estimates were produced using SAE techniques that relied on the pooled 2012–2017 U.S. PIAAC data as well as data from the American Community Survey (2013-2017). As mentioned above, the state and county indirect estimates are provided at the PIAAC Skills Map website.
The statistical modeling approach that was selected, computes the indirect estimates for states as weighted aggregates of the indirect county estimates. Thus, an explanation of the PIAAC SAE modeling appropriately begins with the method of producing the indirect county estimates, which depend on (1) PIAAC’s direct survey estimates, (2) Hierarchical Bayes (HB) linear three-fold models, (3) a set of predictor variables (available and measured consistently for all counties), and (4) a thorough evaluation of the model, as explained next.
- Preparing direct survey estimates. As a nationally representative sample, PIAAC does not produce efficient direct estimates at the county level; as a result, the variances of the direct estimates can be large. This is particularly true for counties with small sample sizes. Therefore, prior to applying any SAE model, Survey Regression Estimation (SRE) was used to reduce the variance associated with the survey’s direct estimates. Rao and Molina (2015, pp. 21–23) describe the use of these estimates in SAE and provide their derivation. The predictors for the SRE model (not the same as the predictor variables for the SAE model, discussed below) were chosen based on the availability of population totals that had the same definition and coverage as the corresponding PIAAC variables. These predictors were further limited to PIAAC variables that had a low level of item nonresponse (less than 5%). The models for the four literacy and four numeracy estimates (listed above) used the same set of predictors, relating to age, gender, race/ethnicity, educational attainment by age, and nativity. The SRE greatly reduced the variance estimates, and the SRE estimates became inputs into the SAE model.
- Hierarchical Bayes (HB) linear three-fold models. The SAE approach used to produce the indirect county estimates involves several models, and an extensive simulation study led to the selection of the final form of the models. (The simulation also showed that the resulting credible intervals had appropriate coverage rates of the true values of the outcome measures.) Specifically, the Hierarchical Bayes (HB) linear three-fold models used to produce the indirect county estimates were:
- a bivariate model, to fit the proportions at or below Level 1 and at or above Level 3, which was then used to derive the proportion at Level 2, and
- a univariate model, to fit the average score.
Separate models were produced for the literacy and numeracy estimates. Two-fold models are discussed in Rao and Molina (2015), and this was extended to three-fold models for PIAAC where all the models included three nested levels of random effects: county, state, and census division. (The R package RSTAN, which provides flexibility in model fitting, prediction, and diagnostics for HB models, was used for the PIAAC SAE study.)
- Selecting a set of predictor variables. PIAAC collected data from just 185 of the 3,142 counties in the U.S. Thus, indirect estimates for counties not in the national samples must rely almost entirely on model predictions (with some contributions from the division and/or state random effects). For the model to predict county levels of proficiency for literacy or numeracy with any reasonable precision, the model depends on effective covariates or predictor variables known to be correlated with literacy and numeracy from past analyses or hypothesized to be correlated with proficiency (such as education, immigration, racial and ethnic minority status, age, employment status, occupation, urban/rural status, and poverty status). The process of model development therefore involved (a) compiling a large number of predictor variables that could be “candidate” predictor variables, and (b) reducing this set of candidates to a manageable set. This was done in two phases.
“The SAE approach used to produce the indirect county estimates involves several models, and an extensive simulation study led to the selection of the final form of the models.”
In the first phase, to initially manage a large number of candidate predictor variables, all the state- and county-level variables were considered as fixed effects and the number of variables was reduced as follows: (1) a correlation matrix was created among all the covariates to identify highly correlated variables, then (2) one variable in each of the highly correlated pairs was dropped to avoid multicollinearity. Subsequently, the LASSO method was used to select several sets of covariates for each of the four outcome models for literacy and numeracy.
In the second phase, these various selected reduced sets of covariates were evaluated and a final list of covariates was determined using a cross-validation process that took into account the more complex model features, including the random effect estimations. This final list of covariates, which was used in modeling all eight outcomes (i.e., literacy/numeracy proportion/average models), consisted of the following seven county-level covariates:
- Proportion of population age 25 and over with less than high school education
- Proportion of population age 25 and over with more than high school education
- Proportion of population below 100 percent of the poverty line
- Proportion of Black or African American population
- Proportion of Hispanic population
- Proportion of civilian noninstitutionalized population with no health insurance coverage
- Proportion of population age 16 and over with ser- vice occupations
The source for these seven covariates was the Census Bureau’s American Community Survey 2013-2017 data.
“The precision of the indirect estimates depends heavily on the ability of the covariates in the model to predict the outcomes.”
- Evaluating the model. Once the model’s seven covariates were selected, the model was subjected to rigorous diagnostic checks before predictions were made for all 3,142 counties. A variety of methods was used to evaluate the fit of the HB models to the county SRE estimates. These included various methods of internal model validation as well as external model validation. The methods of internal model validation included convergence and mixing diagnostics, collinearity tests, residual analysis, posterior predictive checks, model sensitivity checks, examining changes in the specification of the prior distribution for the variance-covariance matrices (including changes in initial values and in hyperparameters values), examining changes in the model specification (including univariate versus bivariate models for literacy proportions, tuning parameters in the Hamiltonian Monte Carlo and no-U-turn samplers algorithms [Hoffman and Gelman, 2011], and relaxed normality assumptions in the bivariate HB models for literacy proportions). The methods of external model validation included examining model validation graphs, histograms of differences, shrink- age plots, interval coverage plots, bubble plots of survey regression estimates and indirect estimates, and smoothed and small area model variances, as well as comparing aggregates of model predictions and direct estimates.
The precision of the indirect estimates depends heavily on the ability of the covariates in the model to predict the outcomes. The indirect estimates produced for counties not in the samples therefore rely almost entirely on the model predictions, with some contributions from the division and/or state random effects. The indirect estimates of counties that were included in the sample (and for which direct estimation is possible) also relied heavily on the model predictions because their direct estimates were based on small samples and are generally imprecise.
Once the county indirect estimates were produced, the indirect estimates for states were computed as weighted aggregates of indirect county estimates, where the weights represent the proportion of the state’s household population of adults ages 16 to 74 in each county. Overall, the state-level estimates are more precise than the county-level estimates, and, to a lesser extent, the state and county estimates from which some persons were sampled in the PIAAC household sample are more precise than state or county estimates that had no persons sampled in the PIAAC household sample.
Precision of the state and county estimates of proficiency
Credible intervals have been computed to indicate the prediction error (i.e., levels of uncertainty) in the indirect estimates. Users need to pay careful attention to the 95 percent credible interval bounds that are provided, along with the indirect estimates to assess the range of uncertainty in the estimates. In general, the credible intervals tend to become wider as the size of the estimated proportion increases.
The coefficient of variation (CV) is another common way of measuring precision. CVs for the county-level estimates for the proportion at or below Level 1 in literacy are generally of the order of 10 percent. Estimates with CVs of this magnitude are considered to be precise (i.e., at a high confidence level). Meanwhile, there is a small number of county estimates that have CVs larger than 50 percent, which are imprecise and are indicated as low confidence estimates in the PIAAC Skills Map. The state predictions are more precise, with a median CV of 8.1 percent.
For example, for the proportion at or below Level 1 in literacy, the median credible interval width for county estimates is 8.0 percentage points, while for the state estimates the median is 6.1 percentage points. The median credible interval width is 7.2 percentage points for county estimates that had persons in the PIAAC 2012/2014/2017 household sample and 8.0 percent for county estimates that had no persons in the PIAAC household sample. The accuracy level for the other five types of proportion estimates (i.e., the proportion at Level 2 and the proportion at or above Level 3 in literacy and the three proportions in numeracy) is similar to that for the proportion at or below Level 1 in literacy, with slightly larger credible intervals and slightly smaller CVs. For the average literacy score, the median credible interval width is about 19 for county estimates and 11 for state estimates, and the CVs are generally around 2 percent for county estimates and 1 percent for state estimates. The accuracy level for average numeracy score is similar to that for average literacy score.
Comparisons between counties, states, and the nation
In addition to the need for state and county estimates, policymakers and educators are often interested in making comparisons between counties, states, and the nation. The PIAAC Skills Map presents comparisons of two areas at a time. For example, a county can be compared to another county, or a county can be compared to the state it is in, or a state can be compared to another state or the nation as a whole. For a given pair of areas – (county1, county2) or (county1, state1) or (state1, state2) or (state1, nation) – the hypothesis testing, of the difference being equal to zero, is performed in eight measurements (proportions of the area’s population at or below Level 1, at Level 2, and at or above Level 3, and average scores in both literacy and numeracy domains). The results are reported as “statistically” different when they are significant at the critical significance level that was adjusted using the Bonferroni method, an adjustment to account for the additional statistical error that occurs when conducting multiple comparisons simultaneously. Meanwhile, the results reported as “notably” different are differences that are not significant under the Bonferroni adjusted critical significance level, but are significant under a single test at the α (type 1 error) =0.05 level.
References
Hoffman, M.D., and Gelman, A. (2011). “The No-U-Turn Sampler: Adaptively Setting Path Lengths in Hamiltonian Monte Carlo.” arXiv 1111.4246. http://arxiv.org/abs/1111.4246.
Rao, J.N.K., and Molina, I. (2015). Small Area Estimation (Wiley Series in Survey Methodology) (2nd ed.). Hoboken, New Jersey: Wiley.
About the authors
Tom Krenzke is a Westat Vice President and Senior Statistical Fellow. He has expertise in survey sampling and estimation techniques, and has led research in statistical confidentiality, sample design, non-probability sampling, small area estimation, variance estimation, imputation, and nonresponse bias.
Leyla Mohadjer, PhD, is a Westat Vice President and Senior Statistical Fellow. Her special areas of expertise include sample design, weighting and estimation for complex surveys in national and international settings, small area estimation, establishing total quality assurance and quality control procedures for international surveys, and nonresponse bias analysis.
Acknowledgments
The authors would like to thank the dedicated team who helped generate the estimates and create the Skills Map for the Program for the International Assessment of Adult Competencies (PIAAC). We are grateful for key contributors to the small area estimation process including Robert Fay, who co-authored one of the first, if not the first, paper on small area estimation, and J.N.K. Rao, who wrote the main book on the subject.
Other important contributors from the Westat statistical team include Jane Li, Weijia Ren, Andreea Erciulescu, Lin Li, and Wendy Van de Kerckhove. Westat statistical programmer Ying Chen provided invaluable support. An international expert panel brought the latest research to bear. The panel included William Bell, Partha Lahiri, Danny Pfeffermann, Dan Sherman, and Avi Singh.
The interactive PIAAC Skills Map was developed by Westat’s Interaction Design Studio team led by Angelica Paul and including Alexander Schneider, Justin Kemmerer, Meganne Forrestall, and Varun Karne. Special thanks also go to Westat’s PIAAC Project Director Jacquie Hogan, to the National Center for Education Statistics for sponsoring the project, and to the American Institutes for Research for contributing comments.
Capabilities
Statistical MethodsFeatured Expert

Tom Krenzke
Vice President
-
Perspective
Westat Work Shines at 2024 APHSA EMWB ConferenceSeptember 2024
Westat human services experts recently presented at the American Public Human Services Association (APHSA)’s Economic Mobility and Well-Being (EMWB) Conference in Portland, Oregon. At the…
-
Perspective
Westat Tools Help Protect Child PassengersSeptember 2024
Vehicle crashes are a major cause of injuries and fatalities among children, a problem safety advocates in the U.S. acknowledge and work to minimize by…
-
Perspective
International Overdose Awareness Day: August 31, 2024August 2024
Overdose continues to impact the lives of so many around the world. The theme of the 2024 International Overdose Awareness Day, August 31, 2024, is…