This website uses cookies so that we can provide you with the best user experience possible. Cookie information is stored in your browser and performs functions such as recognizing you when you return to our website and helping our team to understand which sections of the website you find most interesting and useful.
Insights
Issue Brief
How Much Would Social Security Disability Insurance Beneficiaries Work Without the Cash Cliff?
August 1, 2019
Laurie May, PhD, and Kevin Baier, PhD, with Jarnee Riley; Jeffrey Taylor, PhD; and Joseph Gasper, PhD
INTRODUCTION
In recent years there has been growing concern that the number of individuals on Social Security Disability Insurance (SSDI) has been increasing rapidly, and that many are entering earlier and staying longer, thus putting extreme pressure on program resources (Burkhauser & Daly, 2012; Liebman, 2015). SSDI provides income supplements to eligible workers who become disabled and are no longer able to engage in Substantial Gainful Activity (SGA). The definition of SGA is the ability to earn more than $1,200 per month (or $2,040 per month if the individual is blind). By definition, individuals who consistently earn above SGA are “not disabled” (i.e., they can work and earn “enough” money) and are, therefore, ineligible for SSDI benefits. SSDI beneficiaries earning more than the SGA limit for more than 12 months (not necessarily consecutive) lose all cash benefits immediately. This complete loss of cash benefits when earnings consistently reach the SGA limit is known as the “cash cliff.” The cash cliff is perceived to be a disincentive for SSDI beneficiaries to work to their capacity or even attempt to work at all for fear of losing their entire cash benefit.
There is evidence that some significant number of SSDI beneficiaries are able to work, at least part-time (Mamun, O’Leary, Wittenburg, & Gregory, 2011). Policy discussions about evidence-based supports that promote SSDI beneficiaries returning to work and alternatives that may relieve mounting pressures on the Disability Trust Fund often are based on assumptions about financial incentives and disincentives to work. In the near future, the Social Security Administration (SSA) plans to initiate several new demonstrations projects to test policies to support beneficiaries’ return to work or test the assumptions underlying those policies. One such potential demonstration (referred to as “the Ultimate Demonstration”) tests the assumption that beneficiaries would return to work if there are no disincentives to doing so. In other words, the Ultimate Demonstration tests whether beneficiaries would return to work if all earnings rules and other work impediments from the SSDI program were removed. Depending upon the answers to these questions, SSA has policy alternatives with the potential to relieve mounting pressures on the Disability Trust Fund, which provides the wherewithal for the SSDI program.
This paper explores the questions potentially answered by the Ultimate Demonstration: How many beneficiaries would work? How much would they earn if there were no disincentives? We investigate these questions by comparing the work behavior and outcomes of SSDI beneficiaries to similar individuals receiving income support from the Veterans Affairs (VA) disability compensation program. The VA program does not condition benefits on low earnings. We find that if the SGA limits were removed, the employment rate of SSDI beneficiaries would increase by 16 percent and average annual earnings among those working would increase between $15,600 and $22,500.
BACKGROUND
Financial pressures on the Disability Trust Fund, along with advances in medicine and vocational rehabilitation, motivated SSA to conduct a number of demonstrations aimed at supporting return-to-work efforts among national samples of disability beneficiaries interested in work (Fichtner & Seligman, 2019). Return-to-work is a win-win situation for the beneficiary and the Disability Trust Fund. In 2006, the Accelerated Benefits Demonstration, a randomized controlled trial (RCT), tested whether earlier access to health care improved health and employment outcomes among new SSDI beneficiaries (Michalopoulous et al., 2011). The Youth Transition Demonstration tested whether providing employment services and other supports, including waivers of certain disability program rules, to youth receiving or potentially eligible to receive benefits improves self-sufficiency as they transition from school to work (Fraker, Mamun, Honeycutt, Thompkins, & Jacobs Valentine, 2014). Also using an RCT, SSA tested a provision of evidence-based medication management and vocational services integrated with behavioral health treatment to Social Security disability beneficiaries in the Mental Health Treatment Study (MHTS) (Frey et al., 2008). The agency also tested potential policy changes to the problem of the cash cliff with the Benefit Offset National Demonstration (BOND) study (Gubits et al., 2018), and now the Promoting Opportunity Demonstration (POD) (Wittenburg et al., 2018). Both studies replace the cash cliff with a “benefit ramp.” For example, instead of an immediate end to cash benefits, BOND reduces benefits more slowly as earnings rise above SGA (offsetting each additional $2 in earnings with a $1 reduction in benefits). Where the MHTS focused on assisting beneficiaries with state-of-the-art medical and vocational intervention with the goal of returning to work, BOND (and now POD) focused on encouraging employment by easing the disincentive to increase earnings.
The MHTS and BOND are complete, and the findings instructive. The MHTS found that many beneficiaries with mental illness want to work, and at least 60 percent of those in the treatment group returned to work (Drake et al., 2013). Those in the treatment group return to work in greater numbers, earn more, work more hours, and report better mental health than beneficiaries in the control group. All of these outcomes were significant. Although earning above SGA was not a stated motivation for the study, nor was it an expected outcome, the final report for the MHTS indicates that no beneficiary (in either treatment or control groups) worked within 75 percent of SGA (Frey et al., 2011). BOND failed to find confirmatory evidence that the offset increased the average earnings of SSDI recipients relative to current law (Gubits et al., 2018). However, the findings from this one demonstration do not rule out the possibility that changes to SSDI program rules may increase earnings among beneficiaries if structured and implemented differently. For example, in the BOND evaluation report, Gubits et al. (2018) suggest that the impact on earnings may have been larger if the rules were less complex and provided a larger incentive for working (i.e., a smaller reduction in benefits in response to rising income).
With urging from Congress, SSA is considering new ways to solve the mounting pressure on the Disability Trust Fund. The Bipartisan Budget Act of 2015 included, among other things, the renewal of demonstration authority for SSA. The Ultimate Demonstration directly tests the assumption that beneficiaries will respond to financial incentives—the removing of all earnings rules and other work impediments. Authors of the BOND Final Report argue for such a demonstration (Gubits et al., 2018), and SSA has an expert committee exploring the design of such a study.
APPROACH
In this paper, we provide insight into the magnitude of the effect that removing limits on the amount SSDI beneficiaries can earn would have on their work behavior. We ask the question whether the removal of earnings limits has sufficient potential to generate earnings increases to warrant testing in a major demonstration like the Ultimate Demonstration. We answer this question by comparing the work behavior, and earnings, of SSDI beneficiaries to those of a propensity score-matched group of participants in the VA disability compensation program. We also consider how SSA might utilize information from this analysis to develop and demonstrate new approaches to managing the SSDI program.
In contrast to SSDI, the VA disability compensation program pays cash benefits to veterans who have a service-connected disability. Although congressional language indicates that the intent of VA compensation is to provide a replacement for the average limitation in earning capacity due to disability, in general, unlike SSDI, the VA disability program does not tie receipt of the cash benefit to one’s earning capacity.
The VA determines if a disability is service-connected and then assigns a disability severity rating ranging from 0 to 100 percent disabled. This rating is given in 10 percent increments (0, 10%, 20%, etc.). Individuals rated 30-percent disabled or higher are eligible for cash benefits, and the benefit amount increases with higher ratings. The primary aim of VA disability compensation is to replace lost earnings potential. In general, there is no earnings level above which the benefit is reduced in amount or discontinued (i.e., no “earnings cap”), although there are minor exceptions. A subset of disabled veterans have the additional rating of Individual Unemployability (IU).1 These veterans are subject to an earnings cap very similar to the SGA level in SSDI. Comparing the work behavior of non-IU veterans (with no earnings cap) to the SSDI population (with the SGA earnings cap) can provide insights about the potential impact that removing the SGA limit may have on employment and earnings on SSDI beneficiaries. This analysis approximates the potential effects of an Ultimate Demonstration.
In this paper, we provide insight into the magnitude of the effect that removing limits on the amount SSDI beneficiaries can earn would have on their work behavior.
Controlling for differences in population characteristics between SSDI beneficiaries and VA disability program beneficiaries, we estimate the employment rate and earnings that one would expect to achieve if SSDI beneficiaries operated under the VA disability program rules (effectively eliminating the cash cliff). Specifically, we use propensity score weighting to initially balance the groups on observed background characteristics and regression to control for any remaining differences. Propensity score-matched VA program beneficiaries serve as pseudo-SSDI beneficiaries not limited by an earnings cap.
1To be rated as IU one must have at least one service-connected disability rated at least at 60 percent, or two or more service-connected disabilities with at least one disability rated at 40 percent or more with a combined rating of 70 percent or more. In addition to meeting certain disability criteria, the individual must provide evidence that they are unable to engage in substantial gainful employment. IU disabled veterans receive compensation at the 100-percent disabled level.
EMPIRICAL FRAMEWORK: LABOR FORCE PARTICIPATION AND EARNINGS
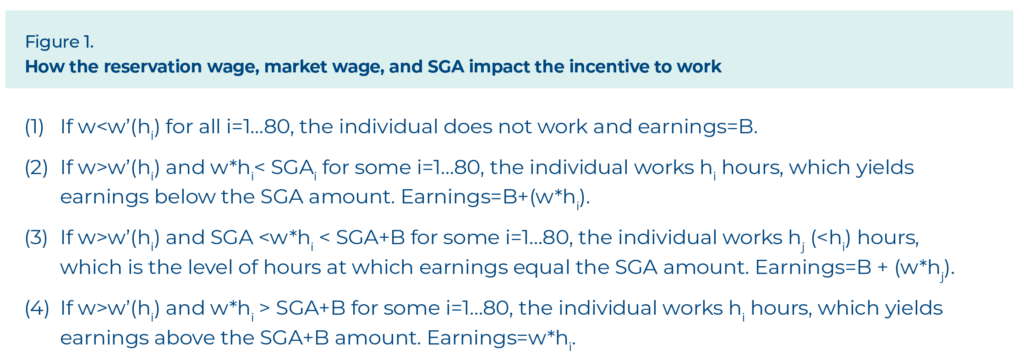
As a first step, it is important to understand SSDI beneficiaries may alter their work and earnings behavior because of a policy change that eliminates the cap on SSDI recipient earnings. Economic theory tells us that each person has a reservation wage at which they will enter the labor force and seek employment (Hall & Lieberman, 2007). In the case of disabled individuals, the reservation wage is most likely higher than it would be in absence of a disability and likely rises with hours worked. For those with severe disabilities, their reservation wage exceeds any wage offerings in the market (equivalent to approaching infinity). How one’s reservation wage (w’), the market wage (w), the benefit (B), and SGA impact the incentive to work can be summarized in Figure 1. If an individual’s reservation wage at feasible levels of hours worked (hi) (assumed to range from 1 to 80) is above the market wage (w), they will not work and their income will be equal to their SSDI benefit (B). Alternatively, if their reservation wage over the range of feasible hours worked is ever at or below the market wage, they will seek to work.2 However, they will only seek work above the SGA level if their earnings at the number of hours worked are sufficient to offset the loss of SGA. For an individual to work above SGA, their market wage at the hours worked must yield earnings that exceed SGA and offset the benefit loss.
In contrast, under the VA disability compensation program, the receipt of benefits is not tied to earnings levels. A veteran with a disability can have any level of earnings and still receive benefits. Therefore, those individuals will work as long as their market wage is above their reservation wage.
This fundamental difference between the SSDI and VA disability compensation program provides a window into how SSDI recipients might alter their work and earnings behavior if they faced no loss of benefits. To explore this question, we estimate a standard two-stage labor force participation and earnings model using a sample of SSDI and VA disability recipients.
2Mitra (2007) found that 13 percent of a cohort of SSDI beneficiaries who joined the rolls in 1981–1982 would be willing to work if offered a job at their reservation wages and about half of them would want a wage that is 80 percent or less of the last wage earned before getting onto SSDI.
PROGRAM PARTICIPANTS’ CHARACTERISTICS AND BALANCING THE SAMPLES
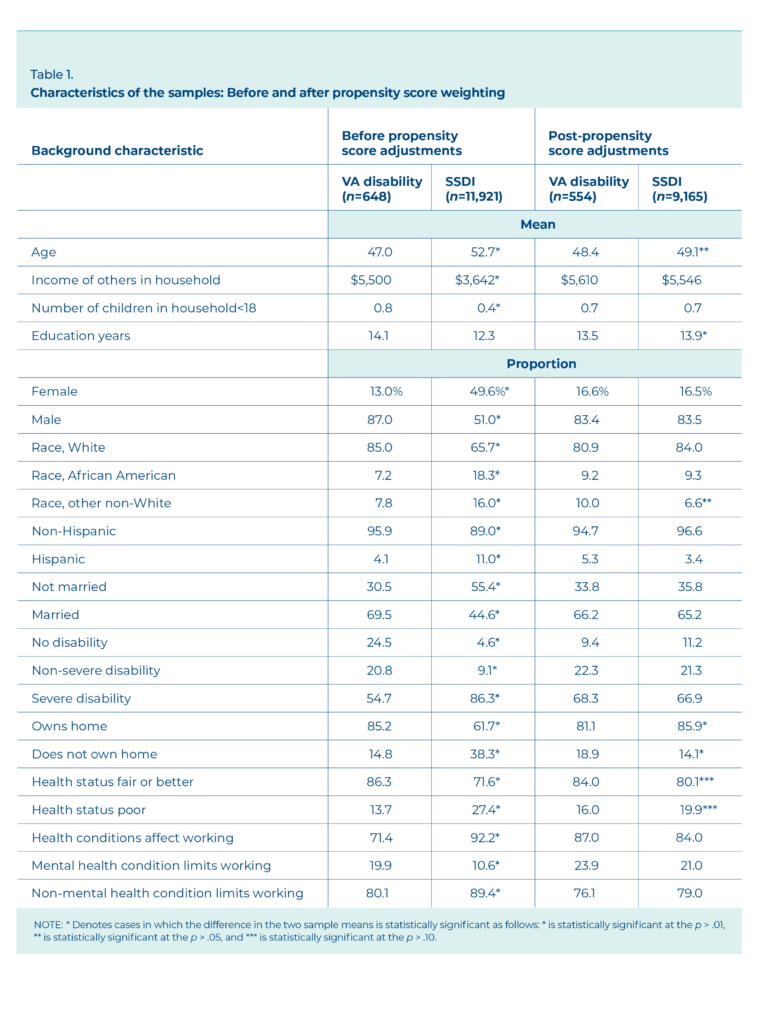
The 2014 Survey of Income and Participation (SIPP) data include disabled individuals on SSDI and VA disability who are between the working ages of 18 and 64. In addition, in 2014 the U.S. Census Bureau fielded an SSA Supplement as part of the SIPP that provides detailed information on disabilities. Although some individuals are eligible for both SSDI and VA disability compensation, we found this group to be relatively small and excluded them from our sample. To lessen the potential complication of respondents’ confusion about their program, we removed a small number of individuals who reported that they were on SSDI as well as Supplemental Security Income (SSI) or state or private disability programs, and individuals who reported earnings more than 20 percent higher than SGA. We also excluded those on VA disability who faced means testing (rated as IU). Finally, as those in the VA system include individuals with less severe disabilities than does SSDI, we restricted our sample to those on VA disability who are rated at least 70-percent disabled.3 Our initial sample has 11,921 individuals on SSDI only, and 648 on VA disability only, for a total of 12,569 individuals.
We compared the characteristics of the two samples and found substantial differences. The second and third columns of Table 1 show the characteristics of the SSDI only and VA disability only samples before propensity score weighting. Although those on SSDI and those on VA disability share many of the same characteristics, Table 1 reveals that the two samples have, on average, different socioeconomic and demographic characteristics. Disability on the SIPP is measured as adult disability as specified in the Americans with Disabilities Report Series (Taylor, 2018) and is based on seven questions that are recoded to three disability levels―no disability, non-severe disability, and severe disability. There are individuals on both SSDI and the VA disability program who profile as having no disability based on this battery. Overall, those on VA disability are younger, more likely to be male, White, married, and educated than those on SSDI. Their disabilities are not as severe, their health status is better, and it is more likely that their health conditions do not affect their working. Not surprisingly, those on VA disability live in households where, on average, other members’ total monthly earnings plus income is substantially higher than for SSDI households. We tested the differences in the mean characteristics between the two samples and found all of them to be statistically significant.4 These are shown in the third column by an asterisk.
3SIPP groups disability ratings rather than reporting by each rating. The highest disability level on the SIPP aggregates those rated 70 percent or greater in a single category.
4These data are weighted with sampling weights to reflect national estimates.
We initially balance the samples using propensity score weighting. Using logistic regression, we estimate the probability of being in the VA disability group versus the SSDI group as a function of the individual and household characteristics shown in Table 1. All but one of the parameter estimates are statistically significant at the .01 level, which is consistent with the two groups having different background characteristics. The one exception is the non-severe disability score, which is not statistically significant. We find that 23.1 percent (2,756 out of 11,921) of those in the SSDI sample have propensity scores below the lowest score of any member of the VA disability sample. In contrast, we find that 14.5 percent5 (94 out of 648) of those on VA disability have a propensity score above the highest score of anyone in the SSDI sample. To balance the two samples, we eliminate these two sets of cases and weight the remaining SSDI cases to match the remaining VA disability sample.
5When weighted, this adjustment reduces n by 21 percent, suggesting that the SIPP weights are correlated with cases removed.
The last two columns of Table 1 show the characteristics of the VA disability and SSDI samples after the non-matches are removed and the propensity scores are applied. We apply the propensity score weights by multiplying them by the SIPP sample weights (Ridgeway, Kovalchik, Griffin, & Kabeto, 2015). Weighting the SSDI sample by the propensity scores balances the two samples. The characteristics of the two samples are nearly the same for all the variables examined. However, for age, education years, the race- other category, home ownership, and health status, we cannot conclude using t-tests that the differences between the means (or proportion) is zero at the p > .10 level. These variables are marked with an asterisk in the last column of Table 1. Given the large size of our sample, the t-tests can detect small differences and, thus, are a very conservative measure of balance. The standardized mean difference is a common alternative measure used to assess balance of the covariates. This measure is not sensitive to the sample size, and as it is standardized, comparison across variables on different scales is possible. The standardized mean difference is less than 0.1 for all five of the variables flagged by the t-tests, suggesting the sample means are balanced on these variables as well.
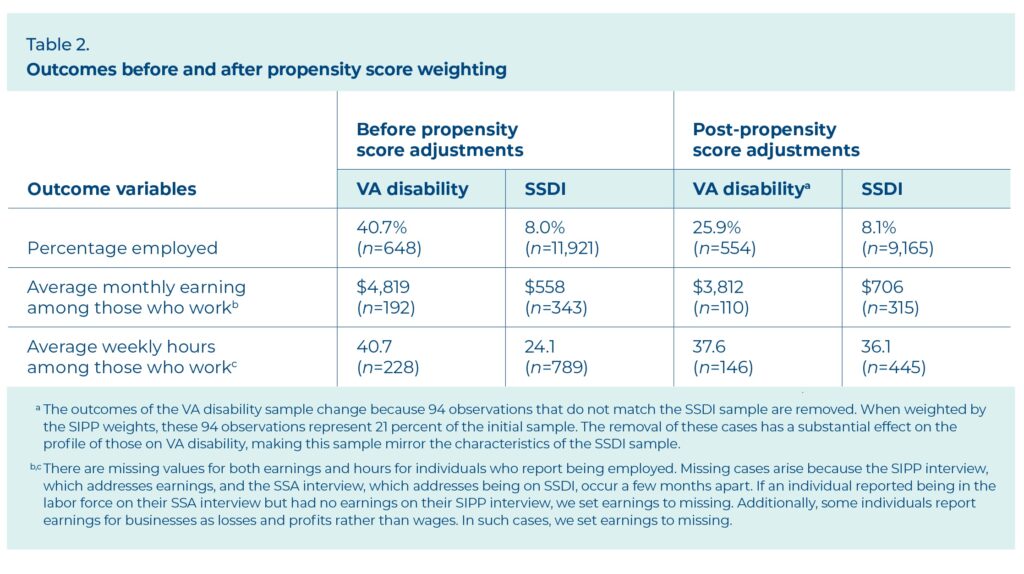
Further insights can be gleaned from examining the outcomes values before and after applying the propensity score adjustments. Removing the non-matching observations and weighting the background characteristics of the individuals (the explanatory variables) by the propensity scores has a substantial impact on the outcomes. Table 2 summarizes the outcomes before and after the propensity score weights are applied. Balancing the two samples results in a final SSDI sample that has a higher employment rate, earnings,6 and hours worked than the initial SSDI sample. Although the employment rate and monthly earnings rise substantially after propensity score weighting, they are still below the levels of the VA sample. In contrast, the hours worked per week increases to the point that it eclipses the average number of hours worked by those on VA disability. The propensity weighting reveals that much of the observed differences in outcomes between the two groups is due to differences in background characteristics. However, differences between the outcomes remain, suggesting the programs have an impact on employment and earnings. We investigate the impact the programs have on outcomes using regression to address any potential remaining background differences.
REGRESSION MODEL
Individuals enter the labor market based on their reservation wage, which reflects the relative value of time at home versus working. We observe whether an individual is in the labor force and, given they are employed, their earnings. Earnings are zero for those who do not work. We use a two-part model that is designed to deal with limited dependent variables to estimate the probability of working and earnings (Belotti, Deb, Manning, & Norton, 2015). The estimates are consistent even if the error terms in the two equations are not independent. We estimate the following two-part model,
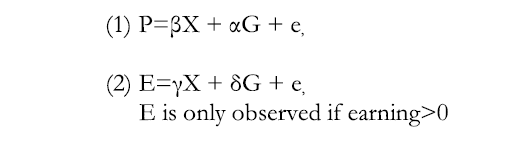
This first equation is the probability of being in the labor force and employed, P, which equals 1 if the person is employed and 0 otherwise. We estimate this equation using a logit model. The probability of being employed is a function of X, a series of independent explanatory variables including age, gender, race,7 having children, the number of children in the household, education, severity of disability, health status, mental health, program group, and household circumstances. Household circumstances affect how people relatively value their time at home and include variables such as being married and having children. Finally, the income of other members in the house as well as asset levels measured by home ownership can affect labor force participation. G is a binary variable representing program group (1 if on VA disability, 0 if on SSDI) and reflects the impact the differences in program rules have on employment .and are the parameters to be estimated, and e is the error term.
The second equation measures earnings in thousands of dollars (E), given employment, and is a function of G and the same set of explanatory variables, X, that influence P. and are the parameters to be estimated, and e is the error term. We estimate the second stage of the two-part model, the earnings equation, two ways. First, we measure earnings using generalized linear modeling (GLM). The advantage of this approach is that GLM is a flexible generalization of ordinary linear regression that allows for dependent variables that have distributions other than a normal distribution. Earnings is modeled by GLM in the following way,
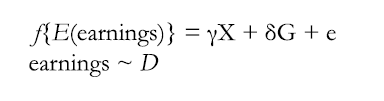
where f{} is the link function and D is the distributional form of earnings. The link function is simply the functional form of the dependent variable in GLM. We used a natural log link function and negative binomial distribution such that earnings were measured in GLM as,
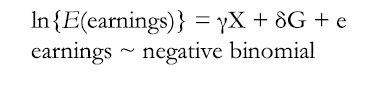
We used a natural log link function and negative binomial distributional family because earnings are skewed to the right. The negative binomial is a right- skewed distribution, and the natural log of a right-skewed variable, such as earnings, helps create a more normal distribution of that variable. In our second estimation approach of the earnings equation, we measure the natural log of earnings using ordinary least squares (OLS).
6SIPP reports earnings from jobs and from operating a business. However, the earnings from operating a business are reported as gross earnings or losses and not as wages. For the small number of cases where an individual was operating a business, we coded them as being in the labor force, but their earnings (wages) were missing.
7There are very few Hispanics in our sample, and this variable is collinear with race. We use only race in our models.
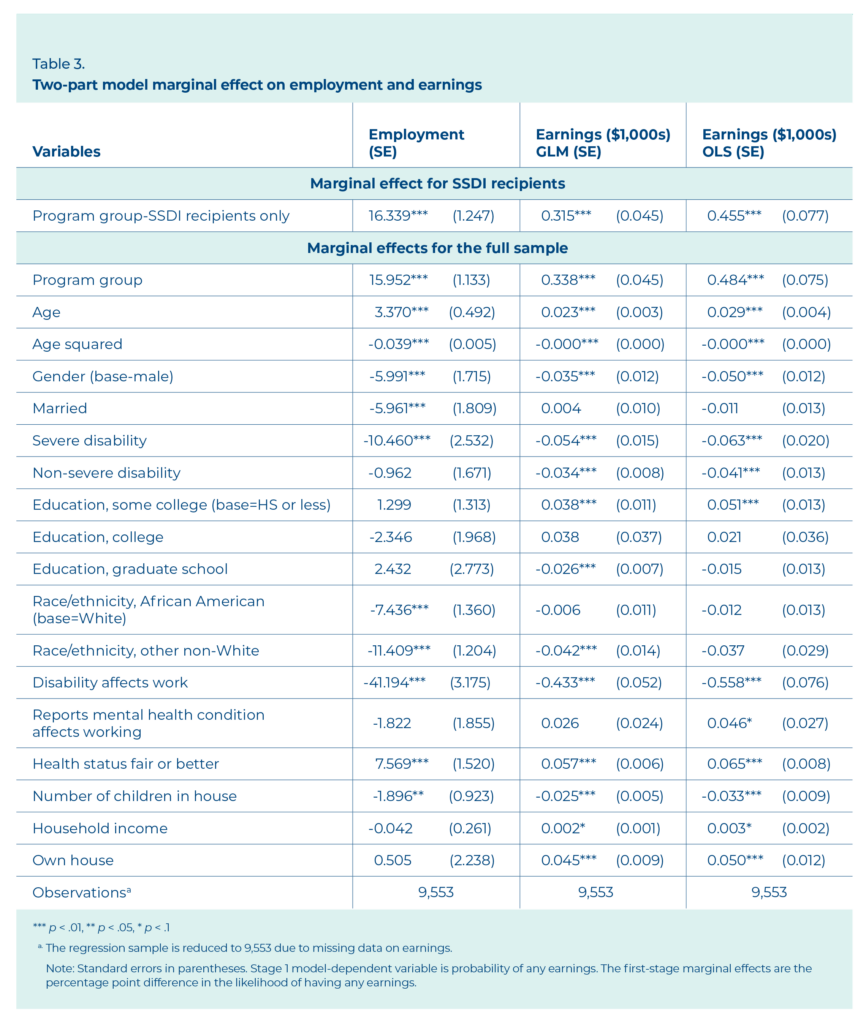
Table 3 shows the regression results for our two-part model in terms of the marginal effects― the effect an independent variable has on the probability of being employed and the effect an independent variable has on expected earnings (in thousands of dollars) given employment. We show the results using both the GLM and OLS methods. We specifically calculate the marginal impacts on employment and earnings for both the SSDI population alone and for the full sample. For all other variables, the marginal effects are for the full sample.
As the estimates of the marginal effects show, if the cap were removed on SSDI earnings, the employment rate among SSDI recipients would increase by 16.339 percent. Similarly, the expected impact of removing the cap on SSDI recipients is to increase average earnings ranging from $315 to $455 a month among all individuals on SSDI.
For the employment equation, the standard explanatory variables associated with labor force participation are of the expected sign and are statistically significant. Factors such as being older, female, married, a minority; having a severe disability; and having more children in the house reduce one’s likelihood of being employed. Having at least fair health status and being in the VA disability system rather than SSDI increases one’s probability of being in the labor force. Neither family income nor home ownership, a measure of one’s assets, is a statistically significant predictor of labor force participation.
The expected impact of removing the cap on SSDI recipients is to increase average earnings ranging from $315 to $455 a month among all individuals on SSDI.
Both estimation methods yield similar estimates for the earnings equations. Earnings are positively affected by age (a proxy for experience), having some college education or graduate school training, home ownership, fair or better health status, and being in the VA disability system rather than SSDI. The binary variable reflecting whether the individual perceives their disability affecting work is generally negative and significant. Being female lowers earnings, but the impact of race is mixed, with other non-White races having lower wages relative to Whites in one of the models but not the other.
POLICY IMPLICATIONS
Our models provide estimates that the marginal impact program group has on employment and earnings. The marginal impact of the program group variable on employment is 16.339, which suggests that the probability of being employed is 16.34 percent higher if one is in the VA system rather than SSDI, holding all other variables constant. The marginal impact of the program group has on earnings ranges $315 to $455 per month, holding all other variables constant.
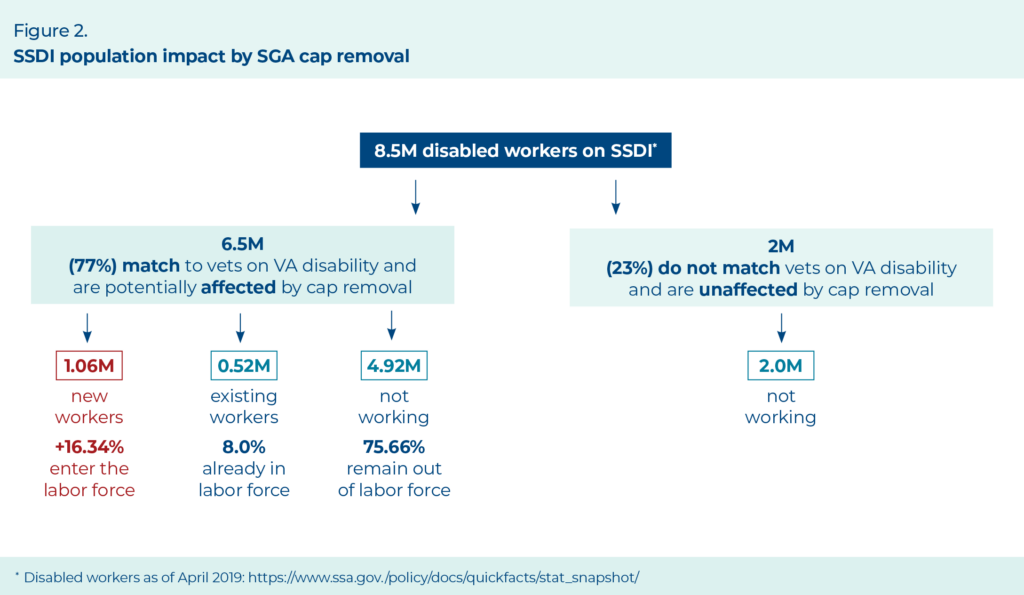
Putting these two estimates together, the behavior of those under the VA disability system suggests that if the caps were removed from SSDI, employment would rise by 16.34 percent and earnings would increase, on average, by $315 to $455 per month for those on SSDI. There are 8.5 million disabled workers on SSDI. Twenty-three percent of those on SSDI did not match those on VA disability, and, presumably, a change in the SSDI earnings cap would not affect these individuals’ behavior. As shown in Figure 2, the remaining 77 percent of SSDI beneficiaries are approximately 6.5 million people. Our results suggest that if the earnings cap was removed, an additional 1.06 million (=0.1634*6.5) individuals would enter the labor force. As 8 percent (.52 million) of our subsample of SSDI recipients already work, the new entrants would raise the total number who worked to 1.58 million (or 18% of all those on SSDI). Based on the model results, the average increase in earnings among all SSDI recipients in our sample would be $315 to $455 per month or $3,780 to $5,460 per year. In aggregate terms, this increase ranges from 24.6 billion (6.5 million*$3,780) to $35.5 billion (6.5 million*$5,460) and would be concentrated among the 1.58 million SSDI recipients who were working. Spreading the increases in earnings just among those working, the average annual increase in earnings ranges from$15,570 to $22,468.
For tax purposes, these increases would be added to SSDI recipients’ family income. Based on payroll taxes8 paid by workers and employees of 15.3 percent a year9 and an approximate marginal income tax rate of 12 percent,10 this added income would generate from $4,250 to $6,134 per case or $6.7 billion to $9.7 billion in additional revenues. The offset per worker is in the range of about 30 to 40 percent of the SSDI payment. We consider all Federal tax payments as savings to the SSDI program although the Social Security payroll tax (6.2% of the 15.3% of payroll taxes) goes directly to the Social Security Trust Fund, which pays for SSDI.
There are two primary implications associated with these findings. First, the analyses indicate that there is a significant number of SSDI recipients who likely can work. Understanding this situation impacts what we think about SSDI recipients in terms of their ability to work, as well as the program rules. Second, the magnitude of the effect of removing the earnings cap has on work behavior suggests that it would be cost effective to invest substantial resources in helping SSDI recipients get back to work.
8Payroll taxes include Social Security and Medicare taxes. Together, the worker pays 7.65 percent of all earnings up to $132,000, and the employer pays an equivalent amount for a total rate of 15.3 percent.
9Understanding the Benefits: https://www.ssa.gov/pubs/EN-05-10024.pdf
10https://www.calculator.net/tax-calculator.html
STUDY LIMITATIONS AND THE NEED FOR DEMONSTRATIONS
There are several limitations to this study. The primary limitation is that we infer a behavioral change for one population (SSDI beneficiaries) based on the experiences of another population (veterans receiving VA disability compensation). This limitation is further exacerbated by the fact that the two populations are substantially different. We used propensity score weighting to balance the two groups and regression to control for any potential remaining differences between them. Although the results of the propensity score analysis suggest that we achieved good balance, the risk we face is that there may be other variables for which we did not take into account that affect employment behavior of one group or the other.
Omitted variables can result in biased estimates. The most salient of these differences is the known difference between the two programs in how they define and assess disability, which may mean that the two groups differ substantially in their level of work-related limitation and disability. Both groups may have similar levels of severity in their medical impairments but differ substantially in their actual ability to work, given that is a critical factor in SSDI determinations but not in the VA’s. Therefore, the estimated impacts of removing the earnings cap require confirmation through a demonstration.
A second study limitation is that the results only consider the impact that eliminating the earnings cap would have on those already on SSDI and do not consider how many new applicants such a change might engender. Removing the earnings cap would likely increase the pool of SSDI applicants, which could easily negate any savings obtained through a higher percentage of individuals working. Previous research found that the number of individuals who could qualify for SSDI but choose not to apply is substantial. From 1998 to 2002, SSA sponsored the National Study of Health and Activity (NSHA) to estimate the number and characteristics of disabled adults in the United States, including the number of people who, but for work or other reasons, are severely enough impaired to be considered disabled according to SSA’s medical eligibility criteria. The first phase of the NSHA included a large pilot study, with nearly 3,900 completed household interviews and 7,465 completed screeners for age-eligible household members. The screening process classified all individuals within the household between the ages of 18 and 69 into one of four groups: (1) disabled SSA beneficiaries, (2) likely disabled non-beneficiaries, (3) possibly disabled non-beneficiaries, and (4) not likely disabled non-beneficiaries. Findings from the pilot study indicate that 5.4 percent (11.9 million) of the 220 million people age 18 to 69 are likely disabled and 7.4 percent (16.3 million) are possibly disabled, suggesting that between 5 and 13 percent of adults could potentially qualify for SSDI if the earnings cap were removed (Frey et al., 2002).
Based on this analysis, one could potentially see applications for SSDI more than double. Presumably, most of these induced applicants already work, and that is why they have not applied for SSDI. Therefore, these individuals would not pay any increased taxes but rather only draw benefits. It would only take approximately 1.5 million induced applicants to overwhelm the projected savings associated with removing the earnings cap.
The policy challenge is to derive new procedures that remove the earnings cap without inducing a significant increase in demand. We suggest exploring potential demonstrations that remove the earnings cap in a way that limits induced demand.
We outline three demonstrations that would measure the magnitude of impact that removing the earnings cap has on work behavior. The first demonstration examines the impact the cap removal has on work given there are no other changes to the SSDI program. For this demonstration to provide accurate estimates of the behavioral responses, the participants must believe that they won’t potentially lose their benefits in the future if they work. Therefore, we recommend that the demonstration focus on individuals age 40 to 50 and provide them a guarantee for life (until retirement age) that their SSDI benefits will not be cut. This counteracts the temporary nature of the demonstration and should elicit the behavioral changes that one would see if the policy was changed permanently. This demonstration would provide a “pure” estimate of the impact of removing the earnings cap as it would not involve any other program changes. However, given the level of induced demand we would expect, removing the cap alone is not a very practical policy.
We suggest exploring potential demonstrations that remove the earnings cap in a way that limits induced demand.
The second and third demonstrations could focus on changing the program to capitalize on the evidence that some people can work while limiting induced demand. In the second demonstration, the only change to SSDI would be to remove the earnings cap after the first Continuing Disability Review (CDR). For most people, the earnings cap would apply for about 4 years, starting prior to their application date and going through to their first CDR. We believe this limit on earnings would be a strong deterrent to induced SSDI program entry.
Induced entry should be a measured demonstration outcome along with the percentage who return to work. The third demonstration examines the impact of making the benefit initially temporary for everyone without an earnings cap. Everyone without an earnings cap would be on SSDI temporarily and receive vocational rehabilitation. After a set period of time, cases would be determined eligible for long-term disability benefits or ready to return to work and no longer eligible for benefits. In this demonstration, the medical review process would be the mechanism that limits induced demand.
CONCLUSIONS
Comparison of the behaviors of SSDI and VA disability recipients suggests that work and earnings of those on SSDI are curtailed due to current program rules that end benefits when earnings rise above the SGA level. A substantial share of the SSDI population (18%) is likely to be able to work and earn a wage that allows them to be self-sufficient. This result has implications for how SSA moves forward with future research and demonstrations as it seeks to return the able-bodied to work and lower program costs. Removing the earnings cap (i.e., SGA criterion) may provide enough incentive to SSDI recipients to work and earn more income. If the behavior is strong enough, it may lower overall program costs through taxable income.
ACKNOWLEDGMENTS
We would like to thank the following individuals for reading and commenting on various drafts of this paper: William Frey, PhD; Howard Goldman, MD, PhD; David Salkever, PhD (University of Maryland Baltimore County); Frank Bennici, PhD; and Stephen Bell, PhD.
May, L., and Baier, K., with Riley, J., Taylor, J., & Gasper, J. (2019, August). How much would Social Security Disability Insurance beneficiaries work without the cash cliff? (Issue Paper, Employment and Disability Research Series).
Rockville, MD: Westat.
REFERENCES
Belotti, F., Deb, P., Manning, W. G., & Norton, E. C. (2015). Twopm: Two-part models. Stata Journal, 15(1), 3-20. Retrieved from: https://doi.org/10.1177/1536867X1501500102
Burkhauser, R. V., & Daly, M. C. (2012). Social Security Disability Insurance: Time for fundamental change. Journal of Policy Analysis and Management, 31(2), 454-461.
Drake, R., Frey, W., Bond, G., Goldman, H., Salkever, D., Miller, A., Moore, T., Riley, J., Karakus, M., & Milfort, R. (2013). Assisting Social Security Disability Insurance beneficiaries with schizophrenia, bipolar disorder, or major depression in returning to work. American Journal of Psychiatry, 170(12), 1433-1441.
Fichtner, J., & Seligman, J. (2019). Developing Social Security Disability (SSDI) reform demonstrations to improve opportunities and outcomes based on lessons learned. Washington, DC: Committee for a Responsible Federal Budget.
Fraker, T., Mamun, A., Honeycutt, T., Thompkins, A., & Jacobs Valentine, E. (2014). Final report on the Youth Transition Demonstration evaluation. Washington, DC: Mathematica Policy Research.
Frey, W. D., Azrin, S. T., Goldman, H. H., Kalasunas, S., Salkever, D. S., Miller, A. L., Bond, G. R., & Drake, R. E. (2008). The Mental Health Treatment Study. Psychiatric Rehabilitation Journal, 31(4), 306-312.
Frey, W., Drake, R., Bond, G., Miller, A., Goldman, H., Salkever, D., Karakus, M., Milfort, R., Riley, J., Reidy, C., Bollmer, J., & Collins, M. (2011). Mental Health Treatment Study: Final report (for Social Security Administration). Rockville, MD: Westat. Retrieved from: http://socialsecurity.gov/disabilityresearch/mentalhealth.htm.
Frey, W., Holloman, H., Riley, J., Gonin, R., Kasper, J., & Kalton, G. (2002). National Study of Health and Activity evaluation report 3: Screening for disability (for Social Security Administration). Rockville, MD: Westat.
Gubits, D., Stapleton, D., Bell, S., Wood, M., Hoffman, D., Croake, S., Mann, D. R., Geyer, J., Greenberg, D., Nichols, A., McGuirk, A., Carroll, M., Kattel, U., & Judkins, D. (2018). BOND implementation and evaluation: Final evaluation report, Volume 1. Washington, DC: Mathematica Policy Research.
Hall, R. E., & Lieberman, M. (2007). Economics: Principles and applications (p. 342). Mason, OH: Cengage Learning. Liebman, J. B. (2015). Understanding the increase in disability insurance benefit receipt in the United States.
Journal of Economic Perspectives, 29(2), 123-150.
Mamun, A., O’Leary, P., Wittenburg, D., & Gregory, J. (2011). Employment among Social Security disability program beneficiaries, 1996-2007. Social Security Bulletin, 71(3), 11-34.
Michalopoulos, C., Wittenburg, D., Israel, D., Schore, J., Warren, A., Zutshi, A., Freedman, S., & Schwartz, L. (2011). The Accelerated Benefits Demonstration and Evaluation Project: Impacts on health and employment at twelve months. New York, NY: MDRC.
Mitra, S. (2007). The reservation wages of Social Security Disability Insurance beneficiaries. Social Security Bulletin, 67(4), 89-111. Retrieved from: https://ssrn.com/abstract=2338122
Ridgeway, G., Kovalchik, S. A., Griffin, B.A., & Kabeto, M. (2015). Propensity score analysis with survey weighted data. Journal of Causal Inference, 3(2), 237-249. Retrieved from: https://www.ncbi.nlm.nih.gov/pmc/articles/PMC5802372/ https://doi:10.1515/jci-2014-0039
Taylor, D. M. (2018). Americans with disabilities: 2014, Home Economic Studies. Current Population Reports, 70-152,
U.S. Census Bureau. Retrieved from: https://www.census.gov/content/dam/Census/library/publications/2018/demo/ p70-152.pdf
Wittenburg, D., Fortson, K., Stapleton, D., Denny-Brown, N., Keith, R., Mann, D., Hock, H., & Gordon, H. (2018). Promoting Opportunity Demonstration: Design report. Washington, DC: Mathematica Policy Research.
Featured Expert

Joseph Gasper
Associate Vice President
-
Perspective
Teacher Apprenticeships Strengthen the WorkforceJuly 2024
Many state education agencies (SEAs) are addressing teacher shortages by creating and expanding alternative paths to the teaching profession. One fast-growing option is teacher apprenticeships,…
-
Expert Interview
Passport to Careers: Aiding Foster and Homeless Young AdultsJuly 2024
The Passport to Careers program in Washington State supports former foster youth and homeless youth unaccompanied by a parent or guardian in achieving their college…
-
Perspective
Highlights of Westat at AAPOR 2024May 2024
We’ve returned from the 79th Annual American Association for Public Opinion Research (AAPOR) Conference, held May 15-17 in Atlanta, where we caught up with colleagues…